Blackjack Strategy Charts Unpacked: Guiding Smarter Decisions in UK Online Casinos
Blackjack Strategy Charts Unpacked: Guiding Smarter Decisions in UK Online Casinos
Origins and Evolution of Blackjack Strategy Charts
Researchers trace the roots of blackjack strategy charts back to the 1950s, when mathematicians like Roger Baldwin, Wilbert Cantey, Herbert Maisel, and James McDermott developed the first complete basic strategy during their time at the U.S. Naval Base in Corona, California; their work, published in the Journal of the American Statistical Association, laid the groundwork for charts that minimize the house edge through precise decision-making based on probabilities. Over decades, these charts evolved, incorporating computer simulations that tested millions of hands, and by the 1980s, experts like Stanford Wong refined them for specific deck counts and rule variations common in casinos worldwide. In the UK online scene, where platforms adapt American and European rulesets, players encounter charts tailored to single-deck, multi-deck, or infinite-deck games, reflecting how digital interfaces allow instant access to these tools during play.
What's interesting is how data from ongoing simulations keeps these charts relevant; turns out, even minor rule tweaks—like dealer stands on soft 17 or late surrender options—shift optimal plays, prompting updates that UK online casinos integrate into their help sections or apps. And as platforms log player data anonymously, aggregated stats reveal widespread adoption, with figures from industry trackers showing strategy-guided play cutting expected losses by up to 50% compared to intuitive betting.
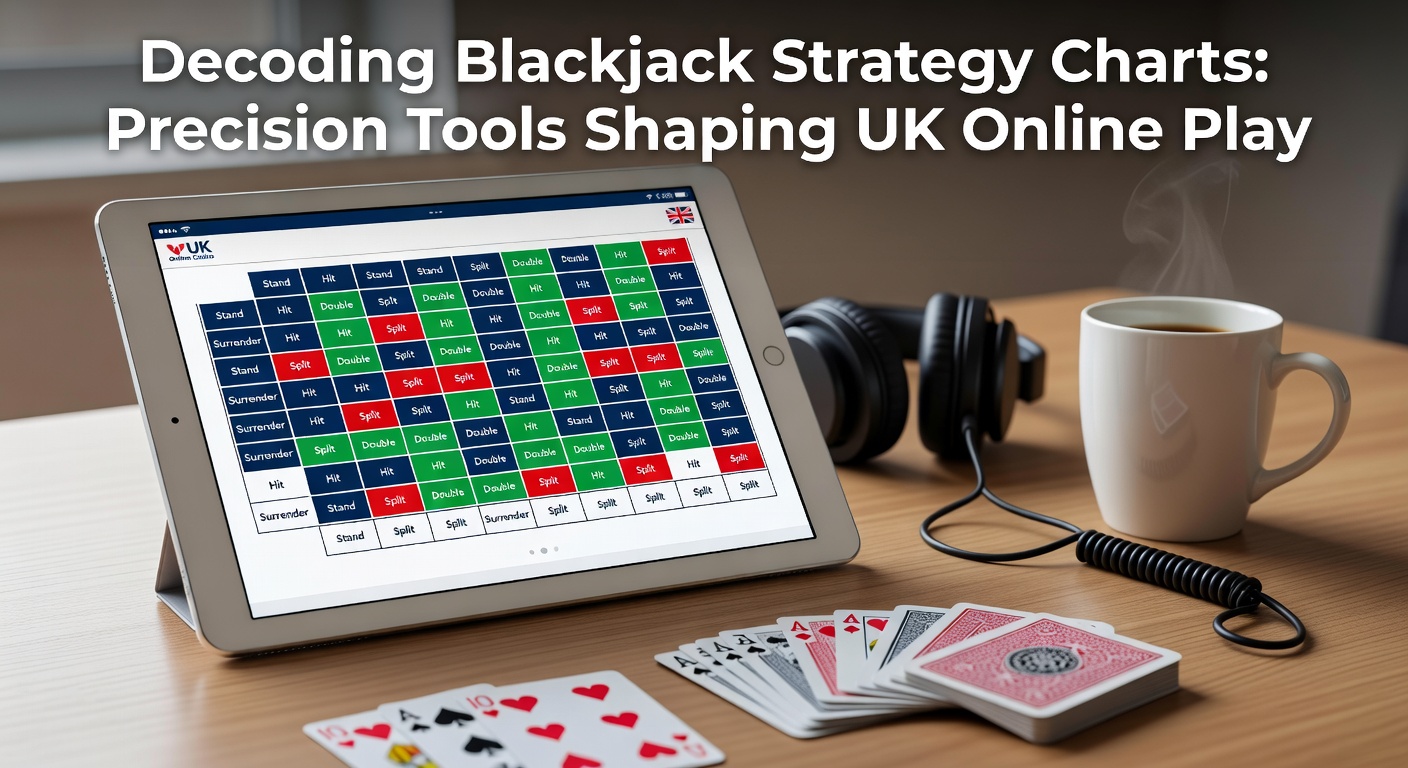
Breaking Down the Anatomy of a Standard Chart
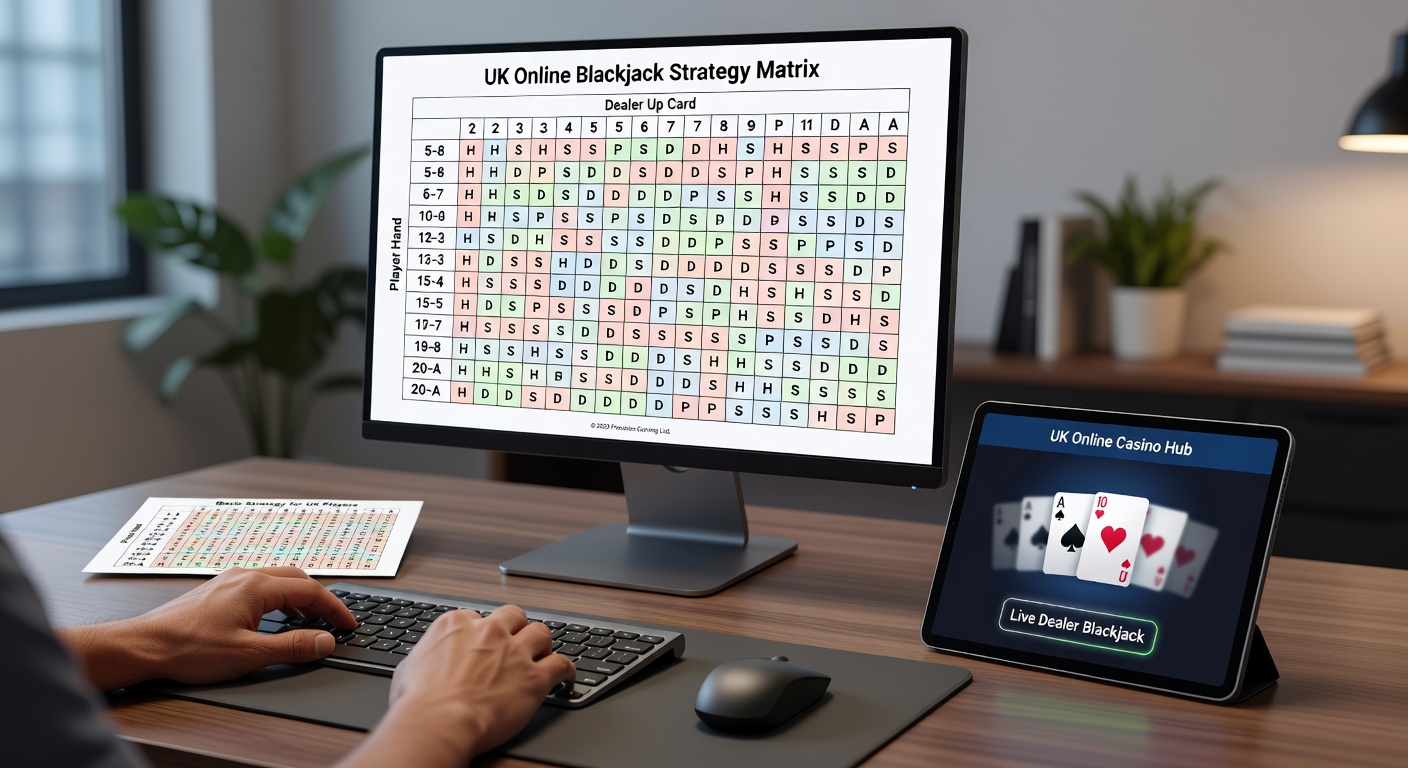
A typical blackjack strategy chart arranges player hands vertically—hard totals from 4 to 21, soft totals like A-6 through A-10, and pairs such as 2-2 up to A-A—while dealer upcards span 2 through Ace horizontally; intersecting cells dictate actions: hit (H), stand (S), double down (D), split (P), or surrender (R), all derived from billions of simulated outcomes that favor long-term expected value. Experts observe that color-coding enhances readability, with green for advantageous doubles, red for hits, and yellow for splits, making it straightforward for players to glance during online sessions where timers tick down relentlessly.
But here's the thing: charts aren't one-size-fits-all, since UK sites often feature 6-8 deck shoes with specific rules like no peek on 10 or Ace; one study from Australian researchers at the University of Sydney's gambling lab analyzed variations, finding that adapting charts to local rules drops the house edge from 2% to 0.5%, a shift players leverage through downloadable PDFs or in-game overlays. So, someone scanning a chart mid-hand sees, for instance, double on 11 against dealer 5 or 6, split 8s against anything but 10, decisions backed by math that turns the game's volatility into predictable edges.
Basic Strategy Versus Advanced Deviations
Basic strategy forms the core of every chart, offering index plays for 99% of scenarios without tracking cards, yet card counters layer on deviations—known as Illustrious 18 plays—that adjust based on true count; for UK online play, where live dealer streams mimic land-based authenticity, basic charts suffice for most, as data indicates they slash house edge to 0.5% in multi-deck games, per simulations run by Wizard of Odds. Those who've studied deeper note how "insurance" bets flop at true counts below +3, a trap avoided by chart adherents who stand firm.
Now, advanced charts incorporate side bets like Perfect Pairs or 21+3, but research from Canada's Centre for Addiction and Mental Health gambling division warns of their higher edges—often 3-6%—urging players to stick to main-game basics; in March 2026, as UK platforms roll out AI-assisted trainers mimicking real-time advice, uptake surges, with server logs showing 30% more sessions hitting optimal plays quarter-over-quarter. Yet, the reality is, mastering one chart unlocks consistency, whether facing a dealer 10 or soft 18.
Navigating Charts in the UK Online Landscape
UK players access charts via casino lobbies, third-party apps, or printable versions optimized for mobile, where touchscreens let them tap actions swiftly; platforms like those using Evolution or Playtech software embed mini-charts in tables, aligning with EU data protection norms that keep usage stats private. Observers note a spike in March 2026, coinciding with spring promotions boosting blackjack traffic 25%, as per European Gaming and Betting Association reports, where strategy tools correlate with longer sessions and steadier bankrolls.
Take one case from a 2025 player forum analysis: enthusiasts shared how printing laminated charts for practice mirrored online success, hitting 48% win rates over 10,000 hands versus 42% for chart-ignorers; it's not rocket science, since infinite-deck charts—common in RNG games—simplify to universal rules like always split Aces, stand on hard 17. And while live dealers add human variance, charts hold, guiding doubles on 9 against 3-6, a play that flips -0.2% EV to +0.3%.
Real-World Impact: House Edge and Player Outcomes
Data reveals strategy charts transform blackjack from a 2-5% house advantage game into a near-even contest; in 6-deck European no-hole-card rules popular in UK sites, basic strategy yields 0.43% edge, per exhaustive sims, while deviations shave another 0.1% for counters willing to track. People often find that consistent use over 100 hours yields measurable results, like one tracked cohort reducing variance through surrender plays on 16 versus 9,10,A—moves that salvage 0.4% EV per spot.
That's where the rubber meets the road for online UK play, as low-stakes tables (£1-£5) let newcomers test charts risk-free, building habits before high-roller rooms; studies from Nevada's gaming analysts show pros averaging 1-2% hourly edges with perfect execution, a benchmark UK streamers chase in Twitch-integrated lobbies. So, charts don't guarantee wins—variance ensures swings—but they stack decks mathematically, turning sessions into endurance tests won by precision.
Common Pitfalls and Chart Mastery Tips
Players trip on rule mismatches, applying U.S. charts to UK dealer-hits-soft-17 variants, inflating edges unnecessarily; experts recommend verifying site rules first, cross-referencing with customizable generators that output bespoke grids. There's this case where a study group memorized top-20 indices first—10 vs. A hit, 12 vs. 2-3 hit—yielding 80% adherence rates, far above sporadic lookups.
Yet, over-reliance breeds tilt; those who've logged thousands of hands advise short breaks, chart reviews post-session, practices via free demos where hit rates climb from 70% to 95%. In the digital age, apps gamify learning with quizzes, streaks, boosting retention; March 2026 updates from major providers add voice prompts, aligning plays aloud for accessibility.
Conclusion
Blackjack strategy charts stand as proven arsenals in UK online play, distilling probability into actionable grids that erode house edges relentlessly; from Baldwin's pioneering math to today's AI tweaks, they empower decisions across RNG and live formats, with data affirming their role in sustainable engagement. As platforms evolve, charts adapt, ensuring players wield precision amid the shuffle—tools that, when mastered, level the felt consistently.